Multiple Choice
Figure 8-2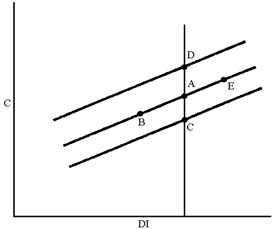
In Figure 8-2, which of the following moves can be explained by a decrease in disposable income?
A) E to B
B) A to C
C) A to D
D) B to E
Correct Answer:

Verified
Correct Answer:
Verified
Related Questions
Q19: If a U.S.citizen buys a car produced
Q37: Inventories are goods that can be considered
Q62: Which of the following would is included
Q76: Which of the following would be most
Q78: Explain why national income and domestic product
Q87: In which of the following years was
Q131: Historical data depicted on a scatter diagram
Q172: Changes in the price level will shift
Q189: Figure 8-1<br><img src="https://d2lvgg3v3hfg70.cloudfront.net/TBX9029/.jpg" alt="Figure 8-1
Q195: For each of the following, how would