Multiple Choice
Figure 8-2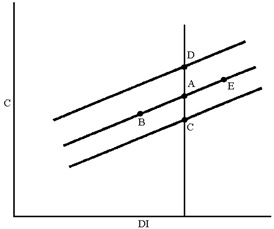
In Figure 8-2, which of the following moves can be explained by a decrease in the price level?
A) A to B
B) A to C
C) A to D
D) A to E
Correct Answer:

Verified
Correct Answer:
Verified
Related Questions
Q1: Figure 8-2<br><img src="https://d2lvgg3v3hfg70.cloudfront.net/TBX9029/.jpg" alt="Figure 8-2
Q6: A change in the value of consumer's
Q7: If inflation rises more quickly in the
Q10: Figure 8-2<br><img src="https://d2lvgg3v3hfg70.cloudfront.net/TBX9029/.jpg" alt="Figure 8-2
Q16: The main reason that the 1975, 2008,
Q134: Which of the following is not a
Q139: Among the following, which would not be
Q151: If consumers receive an increase in income
Q169: Aggregate demand is the total demand for
Q201: The government component (G) of total output