Multiple Choice
Figure 8-2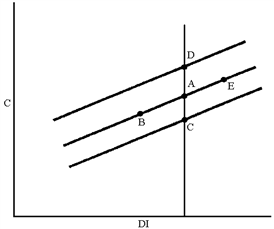
In Figure 8-2, which of the following moves can be explained by a decrease in the prices of stock on the NASDAQ?
A) A to B
B) A to C
C) A to D
D) A to E
Correct Answer:

Verified
Correct Answer:
Verified
Related Questions
Q14: The marginal propensity to consume is<br>A)disposable income
Q30: Changes to the price level affect consumers'
Q64: Figure 8-1<br> <img src="https://d2lvgg3v3hfg70.cloudfront.net/TB8592/.jpg" alt="Figure 8-1
Q106: A major employer in a small town
Q137: If the MPC increases in value, what
Q138: If consumers' expectations about future income are
Q175: In Macronesia, the MPC is approximately 0.80.If
Q177: According to the relationship represented by the
Q184: In the circular flow model, which of
Q198: A sudden decrease in consumers' wealth-resulting, for