Multiple Choice
Figure 10-6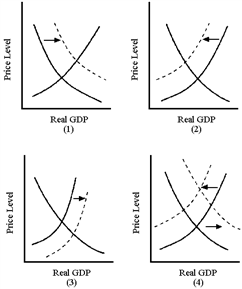
In Figure 10-6, which graph best illustrates an adverse supply shock accompanied by an increase in government spending?
A) -1
B) -2
C) -3
D) -4
Correct Answer:

Verified
Correct Answer:
Verified
Related Questions
Q62: The aggregate supply curve slopes<br>A)downward because firms
Q110: If the MPC of an economy is
Q117: A recessionary gap exists when aggregate demand
Q125: Stagflation exists when prices rise and output
Q150: Self-correcting mechanism reveals that<br>A)real wages will increase
Q173: Aggregate supply grows over time because of
Q202: What is the principal reason that economists
Q204: At levels of output close to full
Q213: Discuss some of the arguments that help
Q216: Figure 10-5 <img src="https://d2lvgg3v3hfg70.cloudfront.net/TB8592/.jpg" alt="Figure 10-5