Multiple Choice
Figure 11-2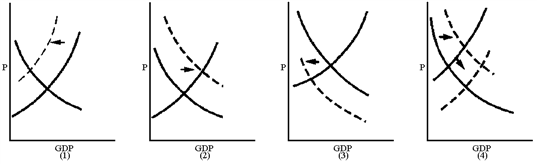
Which graph in Figure 11-2 best reflects a supply-sider's view of the impact of an increase in the personal income tax rate?
A) 1
B) 2
C) 3
D) 4
Correct Answer:

Verified
Correct Answer:
Verified
Related Questions
Q6: Explain why a change in income tax
Q26: The government's fiscal policy is its plan
Q47: A "conservative" would most likely argue in
Q65: Fiscal policy may be mistimed due to<br>A)the
Q87: When the economy has an income tax
Q129: Supply-side economists<br>A)favor a smaller government.<br>B)favor higher marginal
Q135: Suppose that the U.S.personal income tax was
Q161: An increase or decrease in taxes will
Q163: An income tax reduces the size of
Q196: One of the practical issues in the