Multiple Choice
Figure 11-2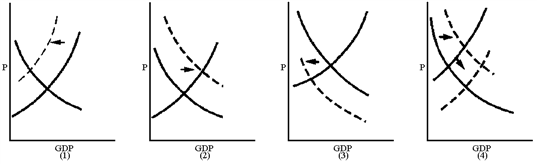
Which graph in Figure 11-2 best reflects a Keynesian's view of the short-run impact of an increase in the personal income tax rate?
A) 1
B) 2
C) 3
D) 4
Correct Answer:

Verified
Correct Answer:
Verified
Q11: Marginal propensity to consume (MPC) is the
Q18: Figure 11-1<br><img src="https://d2lvgg3v3hfg70.cloudfront.net/TBX9029/.jpg" alt="Figure 11-1
Q25: Table 11-1<br><img src="https://d2lvgg3v3hfg70.cloudfront.net/TBX9029/.jpg" alt="Table 11-1
Q57: Tax cuts associated with supply-side economics often
Q74: An increase in Social Security payments to
Q88: If all variable taxes in the United
Q121: Fiscal policy is the use of taxes
Q125: Any tax reduction shifts the consumption schedule
Q130: Table 11-1 <img src="https://d2lvgg3v3hfg70.cloudfront.net/TB8592/.jpg" alt="Table 11-1
Q183: If a "liberal" wanted to decrease aggregate