Multiple Choice
Figure 11-2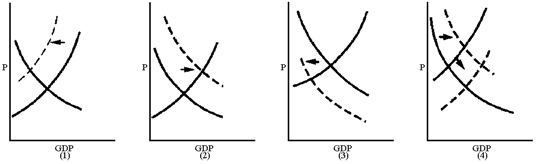
Which graph in Figure 11-2 best reflects a Keynesian's view of the impact of raising taxes on saving?
A) 1
B) 2
C) 3
D) 4
Correct Answer:

Verified
Correct Answer:
Verified
Related Questions
Q12: When you compare the effects of government
Q30: Suppose the federal government is considering alternatives
Q41: In an effort to balance the federal
Q51: An active stabilization policy designed to limit
Q64: A tax reduction shifts the consumption schedule
Q78: Government purchases and income taxes have the
Q82: In 2009, President Obama and Congress stimulated
Q90: Federal budget deficits are often increased by
Q143: According to supply-siders, tax cuts should increase
Q189: If all fixed taxes in the United