Multiple Choice
Figure 11-3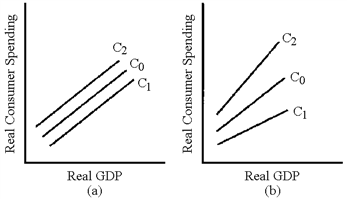
In Figure 11-3, which line represents the change in the consumption schedule caused by a cut in fixed taxes?
A) C1 in graph (a)
B) C2 in graph (a)
C) C1 in graph (b)
D) C2 in graph (b)
Correct Answer:

Verified
Correct Answer:
Verified
Related Questions
Q13: The oversimplified formula for the multiplier yields
Q23: The reason that the multiplier is smaller
Q52: Ronald Reagan's presidency could be characterized as
Q56: Productivity increases, brought about by increased education
Q73: Historically, the government has used fiscal policy
Q80: One of the objections to the supply-side
Q114: Which of the following is an example
Q141: The government's fiscal policy is its plan
Q152: One of the objectives of supply-side policies
Q190: Which of the following statements would appeal