Multiple Choice
Figure 19-2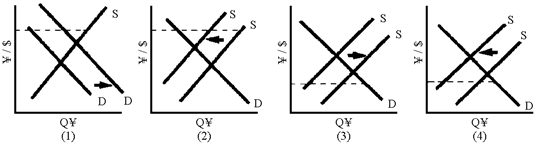
Of the graphs in Figure 19-2, where the broken line represents the fixed exchange rate, which one shows a reduction in the price level in Japan that would reduce a balance of payments deficit?
A) 1
B) 2
C) 3
D) 4
Correct Answer:

Verified
Correct Answer:
Verified
Q1: Fixed exchange rates are rates set by
Q15: The Bretton Woods agreements in 1944<br>A)established the
Q51: When the dollar buys less foreign currency,
Q58: Appreciation is the term used to describe<br>A)the
Q65: Differentiate between the current account balance and
Q94: Which of the following statements is correct?<br>A)In
Q184: Purchasing-power parity theory states that relative prices
Q194: Under a gold standard, a balance of
Q211: If the exchange rate of the Swiss
Q213: According to the purchasing-power parity theory, differences