Multiple Choice
Figure 36-1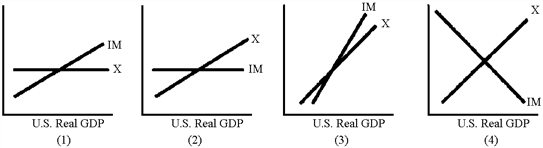
Which of the graphs in Figure 36-1 best illustrates the behavior of exports and imports in relation to U.S. real GDP?
A) 1
B) 2
C) 3
D) 4
Correct Answer:

Verified
Correct Answer:
Verified
Related Questions
Q11: Expansionary fiscal policy in an open economy<br>A)leads
Q48: One unpleasant cure for the U.S.trade deficit
Q57: A fall in the relative prices of
Q104: The growing federal budget deficit in the
Q105: Because monetary stimulus overwhelmed fiscal contraction in
Q117: The sequence of events following an increase
Q122: A depreciation of the dollar will cause
Q136: A fall in the domestic interest rate
Q148: If a currency depreciates,a country's net exports<br>A)fall
Q195: A country's trade surplus is the excess