Multiple Choice
Figure 36-2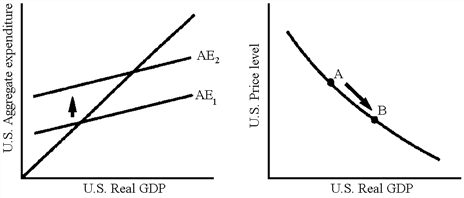
Which of the following explains the movements in Figure 36-2?
A) An increase in the U.S. price level
B) A decrease in the U.S. price level
C) An appreciation of the U.S. dollar
D) An expansionary monetary policy
Correct Answer:

Verified
Correct Answer:
Verified
Q21: In an open economy, the government deficit
Q81: An appreciation of the Japanese yen would
Q140: Figure 36-5<br><img src="https://d2lvgg3v3hfg70.cloudfront.net/TBX9029/.jpg" alt="Figure 36-5
Q142: Table 36-2 <img src="https://d2lvgg3v3hfg70.cloudfront.net/TBX9029/.jpg" alt="Table 36-2
Q147: Following an expansionary monetary policy, we would
Q166: What does macroeconomic theory predict as the
Q169: The expected effect of the Bush tax
Q196: An exchange rate appreciation will shift the
Q207: If the United States increased its budget
Q209: If the demand effect dominates during a