Multiple Choice
Figure 36-5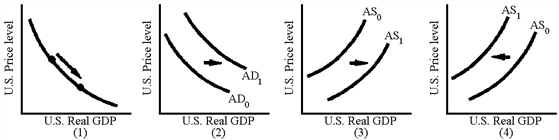
Which of the graphs in Figure 36-5 are consistent with a depreciation of the U.S. dollar and an increase in net exports caused by a decrease in U.S. interest rates?
A) 1
B) 2
C) 3
D) 4
Correct Answer:

Verified
Correct Answer:
Verified
Q37: Depreciation of the Japanese yen would lead
Q50: What are the economic effects of a
Q64: Appreciations or depreciations in currency change international
Q127: International capital flows are purchases and sales
Q142: Table 36-2<br> <img src="https://d2lvgg3v3hfg70.cloudfront.net/TB8592/.jpg" alt="Table 36-2
Q150: The major difference between a closed economy
Q160: Figure 36-6<br><img src="https://d2lvgg3v3hfg70.cloudfront.net/TBX9029/.jpg" alt="Figure 36-6
Q162: Figure 36-7<br><img src="https://d2lvgg3v3hfg70.cloudfront.net/TBX9029/.jpg" alt="Figure 36-7
Q166: Figure 36-6<br><img src="https://d2lvgg3v3hfg70.cloudfront.net/TBX9029/.jpg" alt="Figure 36-6
Q183: A sizable appreciation of the U.S.dollar in