Multiple Choice
Figure 36 -8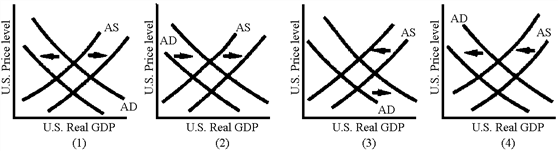
Which of the graphs in Figure 36-8 illustrates the AD-AS shifts induced by the foreign sector following an increase in the U.S. federal deficit?
A) 1
B) 2
C) 3
D) 4
Correct Answer:

Verified
Correct Answer:
Verified
Related Questions
Q12: An open economy is one that trades
Q28: International capital inflows reduce the power of
Q52: The U.S.trade deficit is made possible, in
Q68: Why is monetary policy more effective in
Q75: A rise in interest rates tends to
Q90: An appreciation of the dollar makes imported
Q91: If the dollar appreciates, American consumers will
Q135: Protectionism may fail to reduce a current
Q167: If currency depreciates,<br>A)net exports rise and the
Q208: A closed economy is one that does