Multiple Choice
Figure 36 -8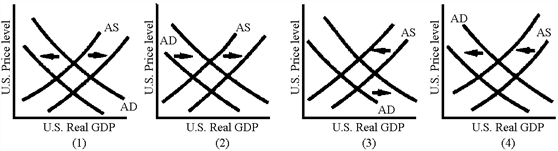
Which of the graphs in Figure 36-8 illustrates the AD-AS shifts associated with a currency depreciation?
A) 1
B) 2
C) 3
D) 4
Correct Answer:

Verified
Correct Answer:
Verified
Related Questions
Q13: Define the following terms and explain their
Q15: Table 36-1 Suppose the economy of Macroland
Q22: One of the principal factors behind the
Q60: The U.S.trade deficits of the late 1990s
Q88: Despite the elimination of the federal budget
Q129: The U.S.trade deficit must be cured by
Q153: For a major country with extensive capital
Q178: When the dollar depreciates, the prices of
Q179: When the dollar appreciates, the prices of
Q186: A reduction in G or an increase