Multiple Choice
Exhibit 2-6 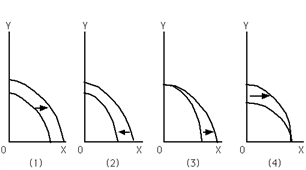
Refer to Exhibit 2-6. Which graph best depicts the consequence of a large-scale natural disaster?
A) (1)
B) (2)
C) (3)
D) (4)
Correct Answer:

Verified
Correct Answer:
Verified
Q104: Exhibit 2-5 <img src="https://d2lvgg3v3hfg70.cloudfront.net/TBX9059/.jpg" alt="Exhibit 2-5
Q105: Productive efficiency implies that<br>A) it is impossible
Q108: Exhibit 2-5 <img src="https://d2lvgg3v3hfg70.cloudfront.net/TBX9059/.jpg" alt="Exhibit 2-5
Q111: Exhibit 2-5 <img src="https://d2lvgg3v3hfg70.cloudfront.net/TBX9059/.jpg" alt="Exhibit 2-5
Q112: The law of increasing opportunity cost helps
Q112: If an economy is operating on its
Q113: Which of the following statements is true?<br>A)In
Q128: Suppose the economy goes from a point
Q151: If there is always a three-for-one tradeoff
Q153: A decrease in unemployment causes the PPF