Multiple Choice
Exhibit 2-6 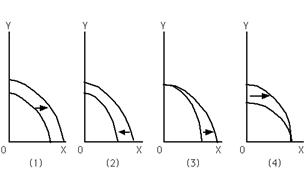
Refer to Exhibit 2-6. Which graph depicts the result of a decrease in the unemployment rate?
A) (1)
B) (2)
C) (3)
D) (4)
E) The result of a decrease in the unemployment rate is not represented by any of the graphs depicted here.
Correct Answer:

Verified
Correct Answer:
Verified
Q2: A PPF is more likely to be
Q44: When opportunity costs are constant,the PPF will
Q82: Exhibit 2-9 <img src="https://d2lvgg3v3hfg70.cloudfront.net/TBX9059/.jpg" alt="Exhibit 2-9
Q83: Exhibit 2-2 <img src="https://d2lvgg3v3hfg70.cloudfront.net/TBX9059/.jpg" alt="Exhibit 2-2
Q84: A society is productive inefficient when<br>A)it produces
Q85: Exhibit 2-9 <img src="https://d2lvgg3v3hfg70.cloudfront.net/TBX9059/.jpg" alt="Exhibit 2-9
Q88: Both country 1 and country 2 are
Q89: Exhibit 2-5 <img src="https://d2lvgg3v3hfg70.cloudfront.net/TBX9059/.jpg" alt="Exhibit 2-5
Q92: Assume that two products are being produced:
Q99: Some of our farm fields are being