Multiple Choice
Exhibit 2-6 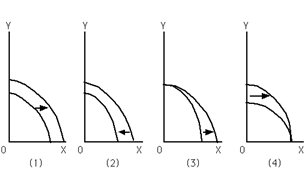
Refer to Exhibit 2-6. Which graph depicts the result of an increase in the number of immigrants entering the country in order to work?
A) (1)
B) (2)
C) (3)
D) (4)
Correct Answer:

Verified
Correct Answer:
Verified
Q7: Along its production possibilities frontier (PPF)an economy
Q54: Using your own words,describe the law of
Q96: Give a definition of an advance in
Q110: Points inside (below)the production possibilities frontier (PPF)are<br>A)
Q113: Which of the following statements is true?<br>A)In
Q120: Suppose an economy can produce a maximum
Q121: Productive inefficiency implies that<br>A)it is possible to
Q122: Exhibit 2-6 <img src="https://d2lvgg3v3hfg70.cloudfront.net/TBX9059/.jpg" alt="Exhibit 2-6
Q148: Points that lie outside (or beyond)the PPF
Q151: If there is always a three-for-one tradeoff