Multiple Choice
Exhibit 4-4 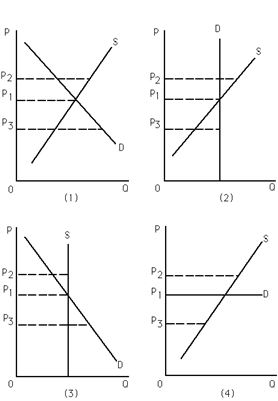
Refer to Exhibit 4-4. Which of the following statements is false ?
A) Graph (1) : A price ceiling set at P2 would not have an impact on the market.
B) Graph (2) : As supply increases, equilibrium price remains constant.
C) Graph (3) : As demand increases, equilibrium quantity remains constant.
D) Graph (4) : As supply increases, equilibrium quantity increases.
Correct Answer:

Verified
Correct Answer:
Verified
Q32: If the price of good X is
Q53: Exhibit 4-8 <img src="https://d2lvgg3v3hfg70.cloudfront.net/TBX9059/.jpg" alt="Exhibit 4-8
Q54: Exhibit 4-10 <br><br><img src="https://d2lvgg3v3hfg70.cloudfront.net/TBX9059/.jpg" alt="Exhibit 4-10
Q58: Situation 4-1 During the winter of 1973-74,
Q59: Exhibit 4-10 <br><br><img src="https://d2lvgg3v3hfg70.cloudfront.net/TBX9059/.jpg" alt="Exhibit 4-10
Q71: A price ceiling set below the equilibrium
Q89: In the market for a given product,when
Q100: Which of the following would not result
Q118: A price ceiling is a government-mandated<br>A) minimum
Q121: In order for a price ceiling to