Multiple Choice
Exhibit 19-5 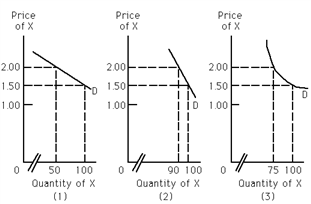
Refer to Exhibit 19-5. Which of the graphs represents a greater percentage change in quantity demanded than the percentage change in price?
A) (1)
B) (2)
C) (3)
D) (2) and (3)
Correct Answer:

Verified
Correct Answer:
Verified
Related Questions
Q63: If for good Z income elasticity is
Q70: Suppose that when the price of cigarettes
Q74: As the price of a product rises
Q100: If the seller of good X raises
Q114: When the cross elasticity of demand between
Q133: If two goods are substitute goods,<br>A)an increase
Q173: Price elasticity of supply measures the responsiveness
Q192: Explain the difference between price elasticity of
Q197: A normal good is<br>A)any good that consumers
Q203: If a good is perfectly inelastic in