Multiple Choice
Exhibit 28-2 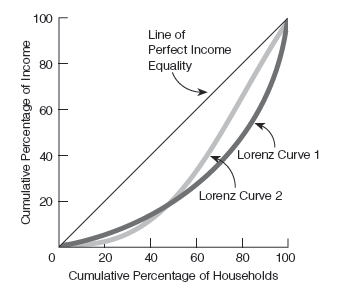
Refer to Exhibit 28-2. This graph depicts the Lorenz curve for two countries, country 1 (Lorenz curve 1) and country 2 (Lorenz curve 2) . The Gini coefficient associated with Lorenz curve 1 appears to be ____________ than the Gini coefficient associated with Lorenz curve 2. This information indicates that the income distribution is ______________ equal in country 2 than in country 1.
A) lower; less
B) higher; less
C) lower; more
D) higher; more
Correct Answer:

Verified
Correct Answer:
Verified
Q10: A Gini coefficient of 2,<br>A)tells us that
Q11: If a person's asset income rises and
Q13: One way to reduce the degree of
Q15: Which of the following statements is false
Q17: In order to make the income distribution
Q32: Which of the following statements is true?<br>A)If
Q37: The Lorenz curve is a graphical representation
Q65: The Gini coefficient is a number between<br>A)0
Q92: An individual's income equals<br>A)labor income + wages
Q97: It is not possible for everyone to