Multiple Choice
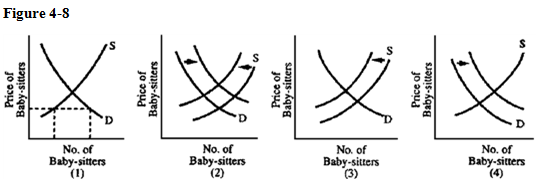 Families are having more children than families did 15 years earlier. As a result, families have more trouble finding baby-sitters and are shocked at the cost of child care. Which graph in Figure 4-8 best illustrates how the situation has changed?
A) 1
B) 2
C) 3
D) 4
Correct Answer:

Verified
Correct Answer:
Verified
Q8: A government policy that prevents the price
Q45: Any event that causes either the demand
Q81: A change in the income of buyers
Q107: We observe that the price of food
Q189: Technological advances that allow a good to
Q254: Figure 4-4 <br><img src="https://d2lvgg3v3hfg70.cloudfront.net/TBX9061/.jpg" alt="Figure 4-4
Q254: If the U.S.government starts to sell off
Q262: Drawing the supply curve and the demand
Q262: The following are the equations for the
Q284: The most basic investigative tool of economics