Multiple Choice
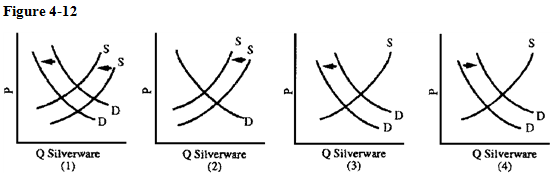
The silverware industry has been in serious decline since the 1980s. Family dining habits are less formal so people purchase less silverware. More recently, the price of silver jumped from $5 to $20 per ounce. Which graph in Figure 4-12 best illustrates these developments?
A) 1
B) 2
C) 3
D) 4
Correct Answer:

Verified
Correct Answer:
Verified
Q39: Price ceilings generally do not lead to
Q62: Which of the following would cause a
Q97: Which of the following is an example
Q146: A demand schedule is a table showing
Q203: Advertising has no effect on the demand
Q212: If supply increases, the equilibrium price will
Q263: If the price of a good rises,
Q270: Any factor that shifts the demand curve
Q279: Suppose demand can be described with the
Q280: <img src="https://d2lvgg3v3hfg70.cloudfront.net/TBX9061/.jpg" alt=" A shortage will