Multiple Choice
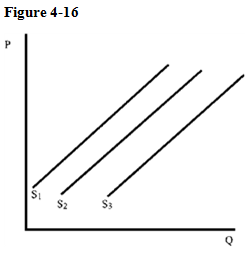
Assume that Figure 4-16 shows the supply of soda. An increase in the price of syrup used in the production of soda will shift supply from
A) S 1 to S 2 .
B) S 2 to S 1 .
C) S 2 to S 3 .
D) S 1 to S 3 .
Correct Answer:

Verified
Correct Answer:
Verified
Related Questions
Q46: The supply curve of books (which are
Q85: A decrease in the price of VCRs
Q134: Explain the effect of the following changes
Q217: The quantity of goods exchanged in a
Q241: At equilibrium, quantity demanded equals quantity supplied.
Q259: The wage rate is the price of
Q273: American consumers learn that grape consumption can
Q276: Price supports increase the supply of affordable
Q290: Pork can be used to produce bacon
Q297: Black-market prices are below equilibrium prices because