Multiple Choice
Figure 6-8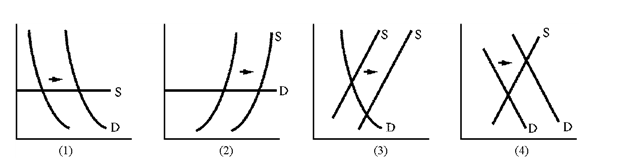
Libya sold more crude oil in 1985 than it sold five years earlier, but revenues were 17 percent less. Which graph in Figure 6-8 is consistent with this set of facts?
A) 1
B) 2
C) 3
D) 4
Correct Answer:

Verified
Correct Answer:
Verified
Q19: Hot dogs and hot dog buns are
Q33: Big Alice Ice Cream Parlor reduced its
Q38: The term "unit elasticity" is used to
Q119: If demand is elastic, an increase in
Q153: A decrease in the price of rice
Q185: The sign of the elasticity computation is
Q209: Figure 6-5<br><img src="https://d2lvgg3v3hfg70.cloudfront.net/TBX9061/.jpg" alt="Figure 6-5
Q212: Figure 6-6<br><img src="https://d2lvgg3v3hfg70.cloudfront.net/TBX9061/.jpg" alt="Figure 6-6
Q224: A price cut will increase the revenue
Q238: If Polaroid wanted damages against Kodak for