Multiple Choice
Figure 6-9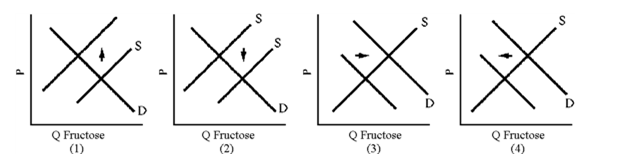
In 1983, government price supports raised the price of sugar above its equilibrium value. Which graph in Figure 6-9 illustrates the impact of sugar price supports on the sugar substitute fructose?
A) 1
B) 2
C) 3
D) 4
Correct Answer:

Verified
Correct Answer:
Verified
Q5: A unit-elastic demand curve never touches or
Q18: How might a court use cross elasticity
Q69: Figure 6-5 <img src="https://d2lvgg3v3hfg70.cloudfront.net/TB8592/.jpg" alt="Figure 6-5
Q73: Elasticity of demand is likely to be
Q78: Figure 6-2 <img src="https://d2lvgg3v3hfg70.cloudfront.net/TB8592/.jpg" alt="Figure 6-2
Q82: Define the following terms and explain their
Q101: As one moves down a straight-line demand
Q105: If there are many close substitutes available
Q128: Perfectly inelastic demand curves are vertical.
Q215: When the price of a sweet roll