Multiple Choice
Figure 7-4 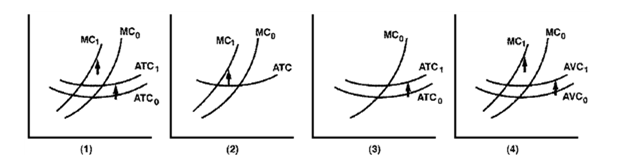
Following a rash of airplane bombs, the airlines have been forced to increase security at a cost of $30 million per year. The number of inspectors and machines does not vary with the number of passengers; the airlines must have sufficient staff available to handle the full-capacity load. Which graph in Figure 7-4 best illustrates the impact of the security expenditures?
A) 1
B) 2
C) 3
D) 4
Correct Answer:

Verified
Correct Answer:
Verified
Q41: If the MPP of labor is 60
Q41: If a firm is using optimal input
Q57: The least costly combination of inputs is
Q85: Figure 7-2<br><img src="https://d2lvgg3v3hfg70.cloudfront.net/TBX9061/.jpg" alt="Figure 7-2
Q90: Figure 7-7 <br><img src="https://d2lvgg3v3hfg70.cloudfront.net/TBX9061/.jpg" alt="Figure 7-7
Q91: Figure 7-17 <br><img src="https://d2lvgg3v3hfg70.cloudfront.net/TBX9061/.jpg" alt="Figure 7-17
Q120: Figure 7-17 <img src="https://d2lvgg3v3hfg70.cloudfront.net/TB8592/.jpg" alt="Figure 7-17
Q153: When economies of scale are present,<br>A)costs per
Q182: Variable costs increase when output rises.
Q239: The graph of the average cost curve<br>A)is