Multiple Choice
Figure 7-5 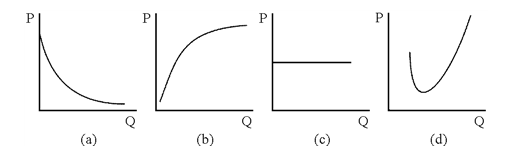
Which of the curves in Figure 7-5 could be a firm's average fixed cost curve?
A) (a)
B) (b)
C) (c)
D) (d)
Correct Answer:

Verified
Correct Answer:
Verified
Q4: Which of the following statements is equivalent
Q25: If the price of one input changes,
Q70: The average total cost curve is U
Q79: A firm's production process shows constant returns
Q109: Figure 7-13 <img src="https://d2lvgg3v3hfg70.cloudfront.net/TB8592/.jpg" alt="Figure 7-13
Q144: Figure 7-13 <img src="https://d2lvgg3v3hfg70.cloudfront.net/TB8592/.jpg" alt="Figure 7-13
Q175: Figure 7-3 <br><img src="https://d2lvgg3v3hfg70.cloudfront.net/TBX9061/.jpg" alt="Figure 7-3
Q179: Table 7-2 <img src="https://d2lvgg3v3hfg70.cloudfront.net/TBX9061/.jpg" alt="Table 7-2
Q181: John Amaker owns orange groves and hires
Q192: In the short run the firm has