Multiple Choice
Figure 7-5 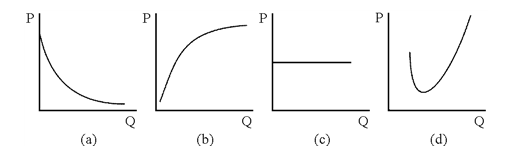
Which of the graphs in Figure 7-5 could be a firm's total fixed cost curve?
A) (a)
B) (b)
C) (c)
D) (d)
Correct Answer:

Verified
Correct Answer:
Verified
Related Questions
Q44: When marginal revenue product of an input
Q49: Total fixed cost falls as output expands.
Q74: If a single large firm is able
Q92: The average cost curve shows the total
Q114: Production indifference curves bow inward toward the
Q205: The amount of time during which at
Q240: Explain briefly the following concepts: <br>a.Increasing returns
Q247: Draw a graph using production indifference curves
Q248: "A producer wanting to employ optimal quantity
Q249: If MPP <sub> a </sub> \P <sub>