Multiple Choice
Figure 7-9 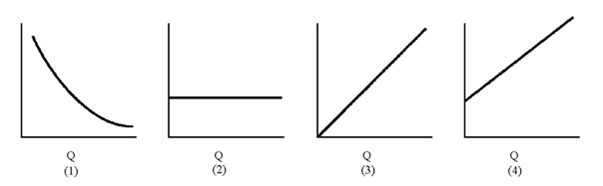
Of the graphs in Figure 7-9, which represents total fixed cost?
A) 1
B) 2
C) 3
D) 4
Correct Answer:

Verified
Correct Answer:
Verified
Related Questions
Q11: Determining the optimal choice of input combinations
Q43: Marginal revenue product is increasing as<br>A)the marginal
Q76: Economies of scale are also called increasing
Q115: Input choices in the present are often
Q154: Figure 7-17 <img src="https://d2lvgg3v3hfg70.cloudfront.net/TB8592/.jpg" alt="Figure 7-17
Q169: Input proportions are usually fixed by technological
Q172: Figure 7-7 <br><img src="https://d2lvgg3v3hfg70.cloudfront.net/TBX9061/.jpg" alt="Figure 7-7
Q190: Marginal physical product can tell a producer<br>A)at
Q219: Renee runs an accounting firm that does
Q242: Average physical product measures the output per