Multiple Choice
Figure 7-10 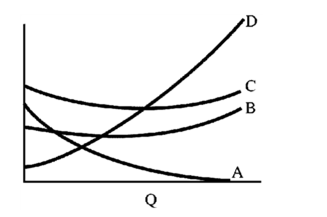
In Figure 7-10, the curve B is
A) average fixed cost.
B) average total cost.
C) average variable cost.
D) marginal cost.
Correct Answer:

Verified
Correct Answer:
Verified
Related Questions
Q16: Table 7-4 <img src="https://d2lvgg3v3hfg70.cloudfront.net/TBX9061/.jpg" alt="Table 7-4
Q19: <img src="https://d2lvgg3v3hfg70.cloudfront.net/TBX9061/.jpg" alt=" In Table 7-1,
Q99: A production indifference curve describes the input
Q104: "Assuming the long-run average cost curve is
Q108: A change in one input price will
Q117: Higher production indifference curves correspond to larger
Q175: If a firm has increasing returns to
Q197: For most industries, average costs decrease indefinitely
Q228: In the long run,<br>A)all of the firm's
Q236: Decreasing returns to scale is strictly a