Multiple Choice
Figure 7-10 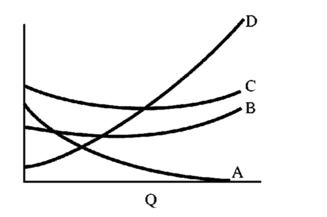
In Figure 7-10, the curve labeled C is
A) average fixed cost.
B) average total cost.
C) average variable cost.
D) marginal cost.
Correct Answer:

Verified
Correct Answer:
Verified
Related Questions
Q73: Figure 7-2 <img src="https://d2lvgg3v3hfg70.cloudfront.net/TB8592/.jpg" alt="Figure 7-2
Q81: A firm practices input substitution when it<br>A)retrains
Q150: The following table depicts the production relationship
Q151: Table 7-5 <img src="https://d2lvgg3v3hfg70.cloudfront.net/TBX9061/.jpg" alt="Table 7-5
Q151: Marginal revenue product is the effect of
Q165: In the short run, the firm has
Q189: Constant returns to scale for a firm
Q203: If the marginal physical product of more
Q231: A firm's optimal input proportions may change
Q241: Are returns to a single input and