Multiple Choice
Figure 7-12 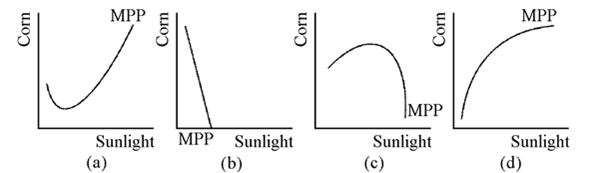
Which of the graphs in Figure 7-12 shows a marginal physical product curve that exhibits first increasing and then diminishing marginal returns to sunlight?
A) (a)
B) (b)
C) (c)
D) (d)
Correct Answer:

Verified
Correct Answer:
Verified
Q21: The "law" of diminishing returns<br>A)is deduced from
Q22: In the short run, a firm has
Q36: The rule for the optimal use of
Q54: Marginal revenue product is the<br>A) additional revenue
Q58: A.B.Denson Company had been employing 6 workers
Q68: Production indifference curves generally have a positive
Q113: Figure 7-15 <br><img src="https://d2lvgg3v3hfg70.cloudfront.net/TBX9061/.jpg" alt="Figure 7-15
Q122: If significant economies of scale are present,
Q128: The optimal level of resource use comes
Q152: If on a given product indifference curve,