Multiple Choice
Figure 7-13 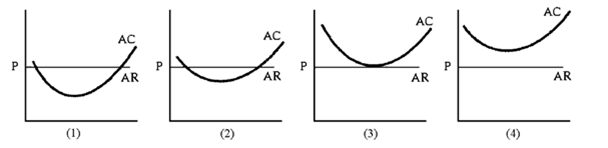
Figure 7-13 shows the average total cost curves of four firms that produce milk. Some of the dairies are more productive. AR = P is the long-run price of milk. How many of these dairies will remain in the industry in the long run?
A) All of them
B) Only 2
C) Only 3
D) Cannot determine with information given
Correct Answer:

Verified
Correct Answer:
Verified
Q24: Where should a producer stop devoting more
Q60: The average total cost curve of a
Q80: Which of the following experiments will yield
Q91: Economies of scale lead to declining long-run
Q145: The long-run average cost curve shows the
Q180: A change in input prices will change
Q186: One reason why critics argue that large
Q199: Which of the following will not lead
Q228: In the long run,<br>A)all of the firm's
Q238: Economies of scale<br>A)require inputs' MPP to fall