Multiple Choice
Figure 8-1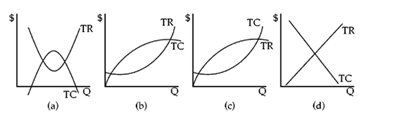
Which graph in Figure 8-1 shows a typical firm's total revenue and total cost curves?
A) (a)
B) (b)
C) (c)
D) (d)
Correct Answer:

Verified
Correct Answer:
Verified
Related Questions
Q4: <img src="https://d2lvgg3v3hfg70.cloudfront.net/TBX9061/.jpg" alt=" To
Q17: The term "satisficing" for decision-making behavior by
Q24: Average cost<br>A)is always larger than marginal cost.<br>B)declines
Q47: If a firm's marginal profit is negative,
Q122: In 1984, British Prime Minister Margaret Thatcher
Q148: Business people often use "hunches" and intuition
Q194: It can be shown that average revenue
Q201: Anna is a tax accountant and she
Q203: According to the text, when management selects
Q224: Total profit<br>A)is the difference between sales revenue