Multiple Choice
Figure 8-5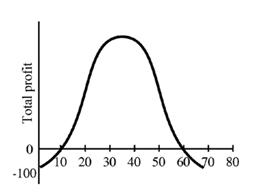
In Figure 8-5, profits are maximized at output of
A) 10
B) 35
C) 50
D) 60
Correct Answer:

Verified
Correct Answer:
Verified
Related Questions
Q31: A graph of total profits is always
Q68: The demand curve for a firm's product
Q78: An optimal level of output is one
Q95: In arriving at the quantity of output
Q112: Over the range of output, a firm's
Q135: A firm is generally more interested in
Q139: If MC > MR,<br>A)output should be reduced.<br>B)marginal
Q173: Marginal profit is the additional profit that
Q180: Marginal revenue is the addition to total
Q221: Firms can make decisions using marginal analysis