Multiple Choice
Figure 18-1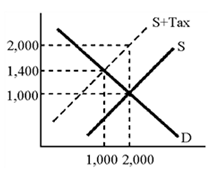
According to the graph in Figure 18-1, the tax is which of the following?
A) 400
B) 600
C) 1,000
D) 200
Correct Answer:

Verified
Correct Answer:
Verified
Related Questions
Q5: An excise tax is<br>A)levied on accounting profits
Q8: The courts in some states have declared
Q64: The way in which most persons pay
Q72: Most loopholes in the income tax system<br>A)are
Q99: Figure 18-2 <img src="https://d2lvgg3v3hfg70.cloudfront.net/TB8592/.jpg" alt="Figure 18-2
Q122: Are property taxes progressive or regressive?
Q157: Homeowners<br>A)are subject to double taxation.<br>B)benefit from several
Q173: Who actually pays an excise tax<br>A)is determined
Q188: Which of the following best reflects the
Q194: A tax has an excess burden whenever<br>A)people