Multiple Choice
Figure 18-1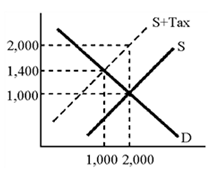
According to the graph in Figure 18-1, the increase in the amount that consumers pay as a result of the tax is
A) 1,000.00
B) 600
C) 400
D) indeterminate.
Correct Answer:

Verified
Correct Answer:
Verified
Related Questions
Q1: Which of the following would be the
Q4: Taxes on sales of liquor, tobacco, and
Q49: Which is not a significant source of
Q59: Define the following terms and explain their
Q70: In the area of taxation, the trade-off
Q71: What is the controversy surrounding property taxes
Q118: The sales tax is generally considered to
Q124: What are the arguments for and against
Q130: The share of GDP going to federal
Q212: Officially, the payroll tax is referred to