Multiple Choice
Figure 2-2 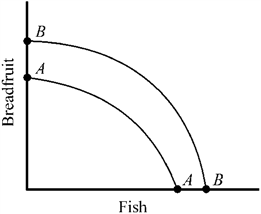
Which of the following would most likely cause the production possibilities curve for breadfruit and fish to shift outward from AA to BB in Figure 2-2?
A) a decrease in the labor force of the country
B) a sudden change in consumer preferences for more fish and less breadfruit
C) a major technological advance
D) a decrease in the capital stock
Correct Answer:

Verified
Correct Answer:
Verified
Q7: If the Internet makes it easier for
Q51: The number of cattle slaughtered every year
Q100: Which of the following is true of
Q146: Which of the following most accurately states
Q200: John takes 10 minutes to iron a
Q202: Which of the following best describes the
Q207: When an economy is operating efficiently, the
Q223: A point outside the production possibilities curve
Q229: The notion that specialization in goods that
Q238: With time, which one of the following