Multiple Choice
Figure 3-22 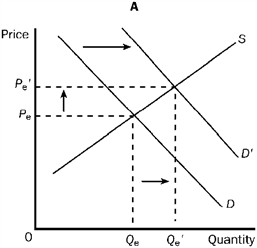
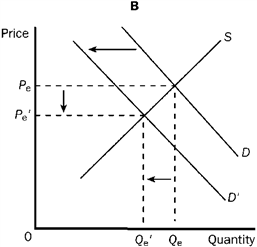
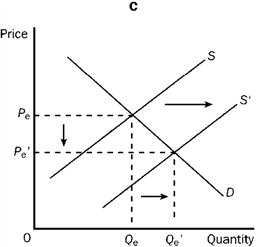
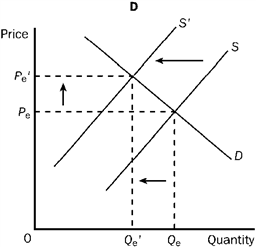
Refer to Figure 3-22. Which of the four graphs represents the market for peanut butter after a major hurricane hits the peanut-growing south?
A) A
B) B
C) C
D) D
Correct Answer:

Verified
Correct Answer:
Verified
Related Questions
Q8: According to the law of supply, as
Q26: A cold spell in Florida extensively reduced
Q86: Which of the following would cause an
Q169: Consumer surplus is the area on the
Q175: If the price of a good is
Q176: Which of the following best represents the
Q177: Figure 3-20 <img src="https://d2lvgg3v3hfg70.cloudfront.net/TBX9057/.jpg" alt="Figure 3-20
Q181: The law of demand indicates that<br>A) every
Q184: The Red Jacket Mountain View Inn in
Q359: If the demand for a good increases,