Multiple Choice
Figure 3-22 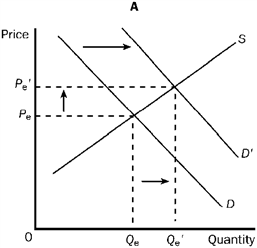
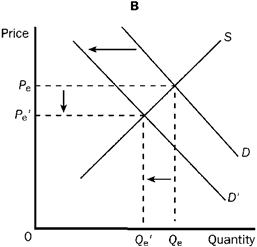
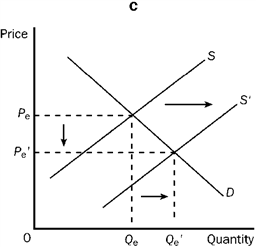
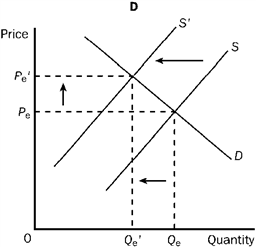
Refer to Figure 3-22. Which of the four graphs illustrates an increase in quantity supplied?
A) A
B) B
C) C
D) D
Correct Answer:

Verified
Correct Answer:
Verified
Related Questions
Q28: Which of the following would most likely
Q167: Which of the following would be the
Q202: If consumer purchases of a good are
Q213: Economists would say that the demand for
Q269: If the price of tickets to the
Q269: According to Adam Smith, what is the
Q275: Figure 3-22 <img src="https://d2lvgg3v3hfg70.cloudfront.net/TBX9057/.jpg" alt="Figure 3-22
Q283: If the demand for a good is
Q308: If price rises, what happens to the
Q428: If coffee and cream are complements, a