Multiple Choice
Figure 3-23 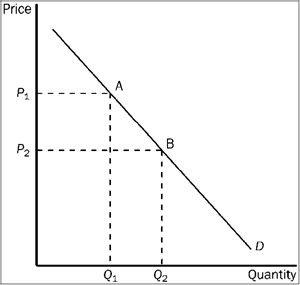
Refer to Figure 3-23. The movement from point A to point B on the graph shows
A) a decrease in demand.
B) an increase in demand.
C) a decrease in quantity demanded.
D) an increase in quantity demanded.
Correct Answer:

Verified
Correct Answer:
Verified
Q65: Which one of the following factors would
Q160: Which of the following will cause a
Q167: Which of the following would be the
Q229: If an increase in the price of
Q269: According to Adam Smith, what is the
Q492: If cigars and cigarettes are substitute goods,
Q493: Figure 3-20 <img src="https://d2lvgg3v3hfg70.cloudfront.net/TBX9057/.jpg" alt="Figure 3-20
Q496: Figure 3-20 <img src="https://d2lvgg3v3hfg70.cloudfront.net/TBX9057/.jpg" alt="Figure 3-20
Q498: Figure 3-15 <img src="https://d2lvgg3v3hfg70.cloudfront.net/TBX9057/.jpg" alt="Figure 3-15
Q500: Which of the following is least likely