Multiple Choice
Figure 3-22 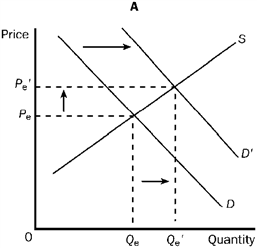
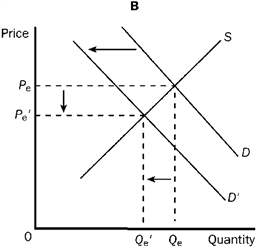
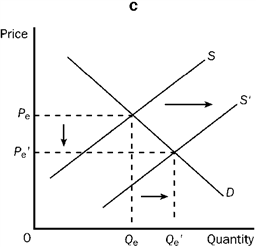
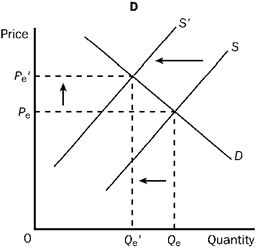
Refer to Figure 3-22. Which of the four graphs represents the market for peanut butter after a major hurricane hits the peanut-growing south?
A) A
B) B
C) C
D) D
Correct Answer:

Verified
Correct Answer:
Verified
Related Questions
Q103: Which of the following is the most
Q235: Which of the following would most likely
Q293: If there is a decrease in both
Q295: The price elasticity of demand for a
Q307: Bill is willing to cut lawns for
Q308: When experts first predicted major weather-related coffee
Q313: Economic efficiency requires that<br>A) individuals take all
Q314: Figure 3-15 <img src="https://d2lvgg3v3hfg70.cloudfront.net/TBX9057/.jpg" alt="Figure 3-15
Q317: Around Easter time, the price of eggs
Q317: Which of the following would decrease the