Multiple Choice
Figure 3-22 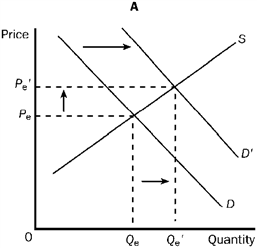
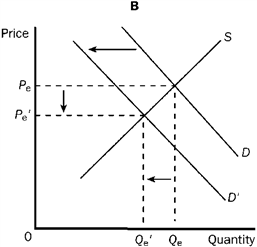
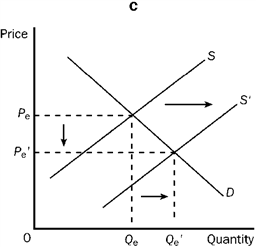
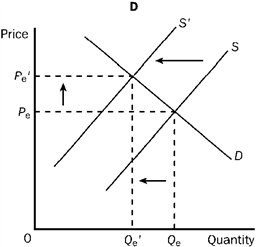
Refer to Figure 3-22. Which of the four graphs illustrates a decrease in quantity demanded?
A) A
B) B
C) C
D) D
Correct Answer:

Verified
Correct Answer:
Verified
Related Questions
Q2: If there is an increase in both
Q91: Which of the following would most likely
Q129: Two goods are considered substitutes if<br>A) a
Q238: Which of the following would increase the
Q296: The height of the demand curve for
Q395: Figure 3-20 <img src="https://d2lvgg3v3hfg70.cloudfront.net/TBX9057/.jpg" alt="Figure 3-20
Q400: If the market price is above the
Q401: In which statement(s) is "supply" used correctly?
Q403: Figure 3-15 <img src="https://d2lvgg3v3hfg70.cloudfront.net/TBX9057/.jpg" alt="Figure 3-15
Q531: How would a decrease in the cost