Multiple Choice
Use the figure below to answer the following question(s) .
Figure 4-7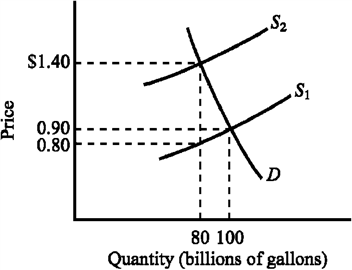
Refer to Figure 4-7. The supply curve S 1 and the demand curve D indicate initial conditions in the market for gasoline. A $.60-per-gallon excise tax on gasoline is levied, which shifts the supply curve from S 1 to S 2. Imposing the tax causes the equilibrium price of gasoline to increase from
A) $.80 to $1.40.
B) $.80 to $1.50.
C) $.90 to $1.50.
D) $.90 to $1.40.
Correct Answer:

Verified
Correct Answer:
Verified
Q15: If the government wants to raise tax
Q43: Suppose the market equilibrium price of corn
Q47: Which of the following is a major
Q57: If a $2 tax per bottle of
Q181: Suppose the United Auto Workers union obtains
Q184: The large amount of violence associated with
Q185: Figure 4-16 <img src="https://d2lvgg3v3hfg70.cloudfront.net/TBX9057/.jpg" alt="Figure 4-16
Q188: If we observe long lines of people
Q202: Bill the butcher is upset because the
Q262: Suppose the federal excise tax rate on