Multiple Choice
Use the figure below to answer the following question(s) .
Figure 4-7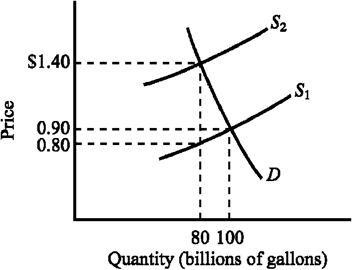
Refer to Figure 4-7. The supply curve S 1 and the demand curve D indicate initial conditions in the market for gasoline. A $.60-per-gallon excise tax on gasoline is levied. How much revenue does the $.60-per-gallon tax generate for the government?
A) $40 billion
B) $48 billion
C) $50 billion
D) $60 billion
Correct Answer:

Verified
Correct Answer:
Verified
Q33: Suppose the demand curve for a good
Q38: Which of the following examples illustrates a
Q116: Because of price controls in the former
Q117: If the Federal government enacts a new
Q118: Figure 4-20 <img src="https://d2lvgg3v3hfg70.cloudfront.net/TBX9057/.jpg" alt="Figure 4-20
Q120: Figure 4-25 <img src="https://d2lvgg3v3hfg70.cloudfront.net/TBX9057/.jpg" alt="Figure 4-25
Q158: Rent control applies to about two-thirds of
Q163: In 2010 the federal government reduced the
Q210: An increase in the demand for a
Q248: A substantial revision of the income tax