Multiple Choice
Use the figure below to answer the following question(s) .
Figure 4-10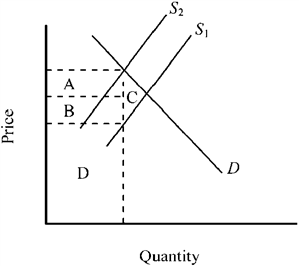
Figure 4-10 shows the market for a good before and after an excise tax is imposed. What does the triangular area C represent?
A) the deadweight loss accompanying the tax
B) the tax revenue derived from sellers
C) the tax revenue derived from buyers
D) the total tax revenue generated by the tax
Correct Answer:

Verified
Correct Answer:
Verified
Q139: Many economists believe a general sales tax
Q155: When a government subsidy is granted to
Q245: The market pricing system corrects an excess
Q267: A $10 per unit government subsidy paid
Q282: Figure 4-21 <img src="https://d2lvgg3v3hfg70.cloudfront.net/TBX9057/.jpg" alt="Figure 4-21
Q283: A tax is levied on products A
Q285: Which of the following is true?<br>A) Most
Q286: Figure 4-24 <img src="https://d2lvgg3v3hfg70.cloudfront.net/TBX9057/.jpg" alt="Figure 4-24
Q288: If there was an increase in the
Q292: Figure 4-21 <img src="https://d2lvgg3v3hfg70.cloudfront.net/TBX9057/.jpg" alt="Figure 4-21