Multiple Choice
Use the figure below to answer the following question(s) .
Figure 4-12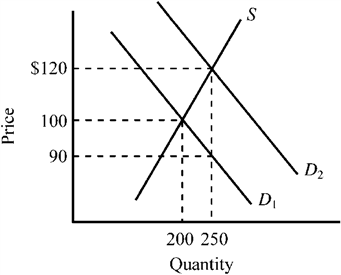
Refer to Figure 4-12. The supply curve S and the demand curve D 1 indicate initial conditions in the market for college textbooks. A new government program is implemented that grants students a $30 per textbook subsidy on every textbook they purchase, shifting the demand curve from D 1 to D 2. Which of the following is true for this subsidy given the information provided in the exhibit?
A) The original average selling price of textbooks was $100, and after the subsidy it rises to $120.
B) $90 represents the net price a buyer must pay for a textbook after taking into account the subsidy payment.
C) Textbook buyers will receive an actual benefit of $10 from the subsidy, while textbook sellers will receive an actual benefit of $20 from the subsidy.
D) All of the above are true.
Correct Answer:

Verified
Correct Answer:
Verified
Q10: The deadweight loss (or excess burden) resulting
Q29: Which of the following will most likely
Q31: When a subsidy program allocates subsidies to
Q33: Use the figure below to answer the
Q34: The tax rate that maximizes the revenue
Q35: In the mid-1940s, the marginal income tax
Q69: When the price of a good is
Q119: Economists have argued that rent control is
Q187: When a shortage of a good is
Q236: A legal system that provides secure private