Multiple Choice
Figure 4-14 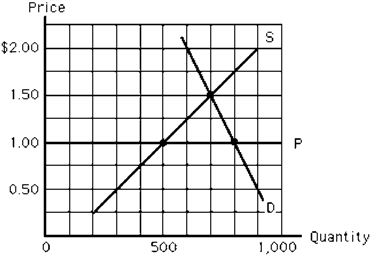
Figure 4-14 depicts the milk market. The horizontal line, P, represents a price ceiling imposed by the government. Which of the following is true?
A) In equilibrium, the quantity demanded is 800 gallons.
B) At the ceiling price, there is a surplus.
C) The quantity demanded at the price ceiling will equal the quantity supplied.
D) The equilibrium price would be $1 per unit without the price ceiling.
E) The quantity sold will be 500 gallons.
Correct Answer:

Verified
Correct Answer:
Verified
Q36: The imposition of price ceilings on a
Q83: Suppose the market equilibrium price of wheat
Q90: When a tax is levied on the
Q92: Figure 4-24 <img src="https://d2lvgg3v3hfg70.cloudfront.net/TBX9057/.jpg" alt="Figure 4-24
Q95: Figure 4-22 <img src="https://d2lvgg3v3hfg70.cloudfront.net/TBX9057/.jpg" alt="Figure 4-22
Q96: If a local government enacts rent control
Q97: Figure 4-18 <img src="https://d2lvgg3v3hfg70.cloudfront.net/TBX9057/.jpg" alt="Figure 4-18
Q98: Use the figure below illustrating the impact
Q109: A price ceiling set below an equilibrium
Q144: In a market economy, which of the