Multiple Choice
Use the figure below to answer the following question(s) .
Figure 7-6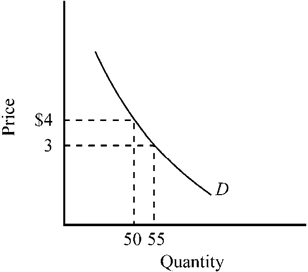
In the price range between $3 and $4, the price elasticity of the demand curve depicted in Figure 7-6 is
A) highly elastic.
B) approximately equal to − 0.33.
C) approximately equal to − 3.
D) of unitary elasticity.
Correct Answer:

Verified
Correct Answer:
Verified
Q91: If the income elasticity of a good
Q109: Table 7-1<br><img src="https://d2lvgg3v3hfg70.cloudfront.net/TBX9057/.jpg" alt="Table 7-1
Q110: If Joe's income increased and as a
Q111: If Mr. Smith thinks the last dollar
Q112: If the price of apples increases, total
Q114: If John's marginal benefit derived from the
Q116: If the price of steak rises from
Q117: Figure 7-14 <img src="https://d2lvgg3v3hfg70.cloudfront.net/TBX9057/.jpg" alt="Figure 7-14
Q136: If a 10 percent rise in price
Q158: If you compared the short-run demand and