Multiple Choice
Figure 9-10 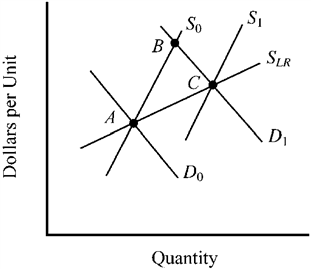
In Figure 9-10, the movement from points A to B to C can best be explained by which of the following factors?
A) a decrease in demand, followed by the entry of new firms and an expansion in supply in a constant cost industry.
B) an increase in demand, followed by the entry of new firms and an expansion in supply in an increasing cost industry.
C) a decrease in demand, followed by the exit of firms and a decline in supply in an increasing cost industry.
D) an increase in demand, followed by the exit of firms and a decline in supply in a constant cost industry.
Correct Answer:

Verified
Correct Answer:
Verified
Q53: If you were the owner of a
Q148: A competitive price-taker firm would be willing
Q177: In a competitive price-taker market,<br>A) many other
Q196: Which of the following is a residual
Q214: If a firm is a price taker
Q217: As the period for firms to expand
Q398: "I have been making furniture for 27
Q399: Which of the following best explains why
Q401: Figure 9-15 <img src="https://d2lvgg3v3hfg70.cloudfront.net/TBX9057/.jpg" alt="Figure 9-15
Q402: A firm is currently operating where the